Price of Singapore Dollar in India – Current Rate and Trends
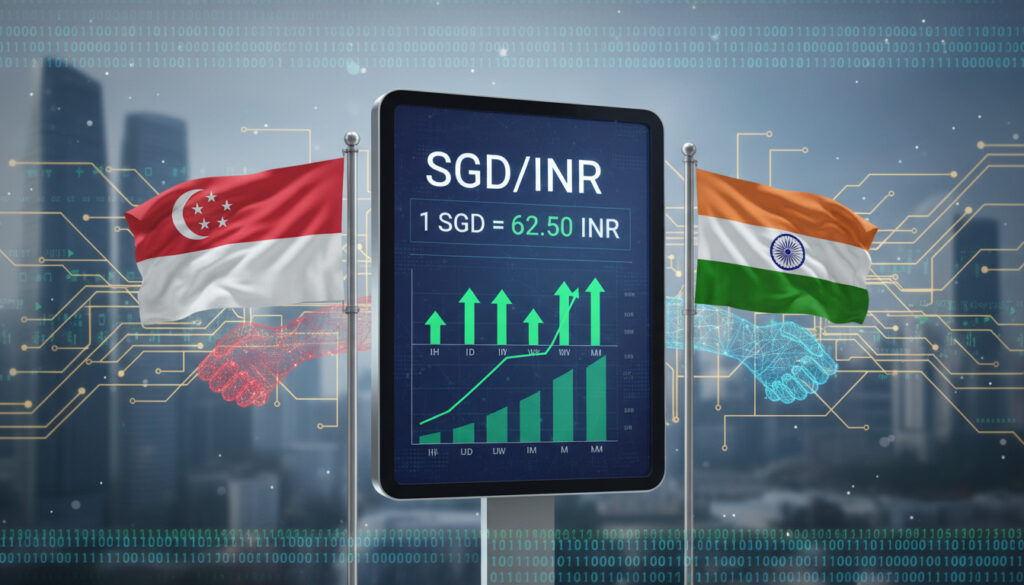
The Singapore Dollar maintains a robust position against the Indian Rupee, with the current mid-market exchange rate fluctuating between approximately 72.30 and 72.51 INR per SGD as of early April 2026. Live data from multiple forex platforms indicates Xe recorded 72.51 INR at 20:12 UTC on April 8, while Wise tracked 71.62 and OFX listed 72.33 as of April 1.
This exchange rate directly impacts over 100,000 Singapore-based Indian nationals sending remittances home, as well as travelers and businesses engaged in bilateral trade between the two nations. The rate’s volatility—ranging from 69.95 to 73.79 INR over the past 90 days—creates both opportunities and risks for currency conversion timing.
Understanding the precise mechanics behind these numbers requires examining real-time converter tools, historical volatility patterns, and the economic factors driving value fluctuations between the Monetary Authority of Singapore’s trade-weighted currency and the Reserve Bank of India’s managed float rupee.
What is the Current SGD to INR Exchange Rate Today?
- Xe data shows 72.51 INR per SGD as of April 8, 2026, 20:12 UTC, representing the highest reported mid-market rate among major providers.
- Wise reports 71.62 INR as the current mid-market benchmark, emphasizing this is a theoretical midpoint rather than an available transfer rate.
- Remitly offers promotional rates up to 73.39 INR for first-time transfers, significantly above standard mid-market levels.
- IBR Live tracks live forex at 72.31 INR, listing this among nine competitive rates available to Indian market participants.
- OFX recorded 72.33 INR as of April 1, 2026, indicating relative stability over the first week of the month.
- Actual bank rates typically lag 1–2% below mid-market rates due to institutional markups and operational overhead.
- 90-day averages hover at 71.87 INR, suggesting the current rate sits above recent historical means.
Conversion Amounts: SGD to INR
| Amount (SGD) | Mid-Market INR | Promo Rate INR | Bank Estimate INR |
|---|---|---|---|
| 1 | 72.40 | 73.39 | 71.00–71.50 |
| 10 | 724.00 | 733.90 | 710.00–715.00 |
| 100 | 7,240.00 | 7,339.00 | 7,100.00–7,150.00 |
| 500 | 36,200.00 | 36,695.00 | 35,500.00–35,750.00 |
| 1,000 | 72,400.00 | 73,390.00 | 71,000.00–71,500.00 |
Where to Check Live SGD to INR Rates and Converters?
Accessing accurate real-time data requires selecting platforms that update frequencies match market movements. Wise provides detailed conversion tables alongside fee transparency calculators, while Xe offers motion charts and rate alert functionalities.
Real-Time Digital Platforms
Specialized forex websites update every few seconds during trading hours. Xe displays historical motion charts showing intraday movements, allowing users to visualize trends beyond static numbers. Wise separates mid-market rates from actual transfer costs, clarifying the spread between informational and transactional pricing.
Mobile-First Applications
Revolut and OFX provide mobile-optimized interfaces targeting frequent travelers and remittance senders. Revolut displays rates at 72.26 INR on primary interfaces, though internal tables sometimes show 66.04 INR depending on account tiers or promotional periods. OFX maintains consistent 72.33 INR readings with additional forward-contract options for large transfers exceeding 50,000 SGD.
Mid-market rates represent the theoretical midpoint between global buy and sell prices. Actual transfers incur margins, fixed fees, or percentage markups. Fintech providers typically charge 0–1% above mid-market, while traditional banks often apply 5% or higher total cost structures.
SGD to INR Historical Trends and Charts
Recent volatility spans narrow bands despite global economic uncertainties. The 30-day range of 71.58 to 73.79 INR demonstrates a 3% fluctuation window, while 90-day data reveals a broader 69.95 to 73.79 band indicating higher variance earlier in the period.
Short-Term Volatility Analysis
Seven-day averages stabilize around 72.37 INR with minimal 0.31% volatility, suggesting recent consolidation. Investing.com tracks daily ranges showing current movement between 72.36 and previous highs of 72.49, indicating tight trading corridors.
Long-Range Pattern Limitations
Comprehensive historical charts extending beyond 12 months remain unavailable in current datasets. Live platforms track one-year mid-market movements, though specific event-driven spikes or troughs lack detailed annotation in accessible sources.
Factors Affecting SGD to INR Exchange Rate and Tips for India
Currency valuations respond to divergent monetary policies between Singapore’s trade-weighted SGD management and India’s inflation-targeting framework. Interest rate differentials, trade balance fluctuations, and geopolitical developments across Southeast Asian and South Asian corridors drive daily movements.
Macroeconomic Drivers
Supply and demand dynamics, inflation differentials, and economic data releases from both nations materially impact rates. The Reserve Bank of India maintains a managed float regime for the rupee, while the Monetary Authority of Singapore utilizes a trade-weighted basket approach, creating divergent response mechanisms to global dollar strength.
Strategic Exchange Locations
Remitly and Western Union dominate remittance corridors with promotional offerings, while IBR Live aggregates nine competitive Indian market providers. Traditional banking institutions including SBI and HDFC maintain physical networks but typically offer less favorable spreads than digital alternatives.
Currency counters at Changi or Indian international airports routinely apply 5% or greater markups above mid-market rates. Digital fintech applications provide superior value for both travelers and remittance senders, with total costs typically below 1%.
Indian residents converting SGD must utilize authorized dealers per Liberalized Remittance Scheme (LRS) regulations. The annual cap stands at $250,000 USD equivalent per individual, requiring PAN documentation for transfers exceeding threshold limits.
Those holding Singapore Dollars might consider interest-bearing accounts to offset exchange risks. The POSB Savings Account Interest Rate provides a benchmark for SGD retention strategies while monitoring INR entry points.
Timeline of SGD to INR Rate Movements
- Xe records 72.51 INR peak Source: Xe currency converter
- OFX fixes 72.33 INR rate Source: OFX exchange rates
- 30-day high reaches 73.79 INR Source: Xe 30-day analysis
- 30-day low drops to 71.58 INR Source: Xe 90-day data
- 90-day low recorded at 69.95 INR Source: Xe 90-day data
- IBR Live tracks live rate at 72.31 INR Source: IBR Live forex data
Established Facts and Open Questions
- Current mid-market range: 72.30–72.51 INR (April 2026)
- Provider-specific rates vary by 0.5–1.5 INR
- 90-day historical range: 69.95–73.79 INR
- Volatility metrics: 0.31% (7-day), 0.41% (30-day)
- Fintech providers consistently outperform banks on margins
- Promotional first-transfer rates reach 73.39 INR
- Specific 2025 year-end forecast figures unavailable
- Exact timing of potential RBI or MAS interventions
- Real-time bank counter rates (location-specific variations)
- Impact of upcoming monetary policy shifts on spread compression
- Long-term historical data beyond 12 months in current datasets
Why the SGD to INR Exchange Rate Matters
The valuation directly affects remittance flows from Singapore’s Indian diaspora, representing a significant component of South Asian foreign exchange reserves. For workers earning in SGD, exchange rate fluctuations impact purchasing power when supporting families in India, making timing crucial for maximum rupee yield.
Business operators face similar exposures. Import-export contracts between the Port of Singapore and Indian manufacturing hubs require hedging strategies against the 3% monthly volatility bands. Western Union estimates vary significantly by transfer method, highlighting how rate knowledge prevents value erosion. For those looking to explore culinary delights, a simple taco pie with crème fraîche can be found at $Tacopaj med creme fraiche.
Individuals exploring Cash Pay Jobs Singapore must calculate real returns after currency conversion, particularly when obligations in INR dominate expense profiles.
Data Sources and Platform Methodologies
“Mid-market rates represent the real exchange rate—the midpoint between the buy and sell prices on the global currency markets. However, these rates are rarely available to consumers without additional fees.”
Wise Currency Converter Methodology
“Exchange rates fluctuate due to market conditions including economic data releases, geopolitical events, and changes in interest rate differentials between issuing central banks.”
Xe Currency Analysis
Key Takeaways on SGD to INR Exchange
The Singapore Dollar trades at approximately 72.40 INR mid-market as of April 2026, with practical exchange rates varying between 71.50 and 73.39 depending on provider selection and promotional eligibility. Travelers and remitters maximize value by utilizing fintech platforms over traditional banking channels, monitoring 30-day volatility bands for optimal timing, and ensuring compliance with RBI documentation requirements for large transfers.
Common Questions
Is 1 SGD stronger than INR?
Yes. One Singapore Dollar exchanges for approximately 72 Indian Rupees, indicating the SGD maintains significantly stronger purchasing power against the rupee.
How often do SGD to INR rates change?
Rates update continuously during forex market hours (24/5). Digital platforms refresh every few seconds, though intraday volatility averages 0.31% over seven-day periods.
What documents are required to exchange SGD in India?
Indian residents need PAN cards for amounts exceeding 50,000 INR equivalents. Foreign visitors require passports with valid visas. Authorized dealer verification is mandatory under RBI guidelines.
Are weekend rates different from weekday rates?
Forex markets close weekends, causing rates to freeze at Friday closing levels. Some providers apply weekend markup fees or suspend transfers until Monday market openings.
Can I lock in an exchange rate for future transfers?
Yes. OFX and similar providers offer forward contracts allowing rate locks for up to 12 months, typically requiring minimum transfer values of 20,000 SGD or equivalent.
Why do different websites show different rates?
Variations reflect different timestamps, provider markups, and mid-market versus retail pricing. Banks display sell rates (lower), while converters show interbank midpoints (higher).
Is there an annual limit for SGD to INR conversion?
Indian residents face a $250,000 USD annual limit under the Liberalized Remittance Scheme. Singapore residents face no outbound SGD restrictions but must declare cash exceeding 30,000 SGD when entering India.
Do credit cards offer good SGD to INR rates?
Credit cards typically apply 2.5–3.5% foreign transaction fees above mid-market rates. Dedicated multi-currency cards from Wise or Revolut offer superior conversion margins for frequent travelers.
More related posts
 Boeing 787-10 – Singapore Airlines, KLM, Etihad Seat Maps
 USD to SGD Rate: Live, Forecast & Why SGD Is So Strong
 Badminton Shop Near Me: Top Ireland Stores & Rackets
 Where to Stay in Chengdu – Best Neighborhoods Guide
 Singapore Short Term Visit Pass: STVP Duration & Extension
 Tamilyogi: Tamil Movie Piracy Risks and Alternatives
 Shaw Theatres Lot One – Showtimes, Tickets & Access
 Jianghu Buffet Orchard Gateway: Menu, Price, Reviews
