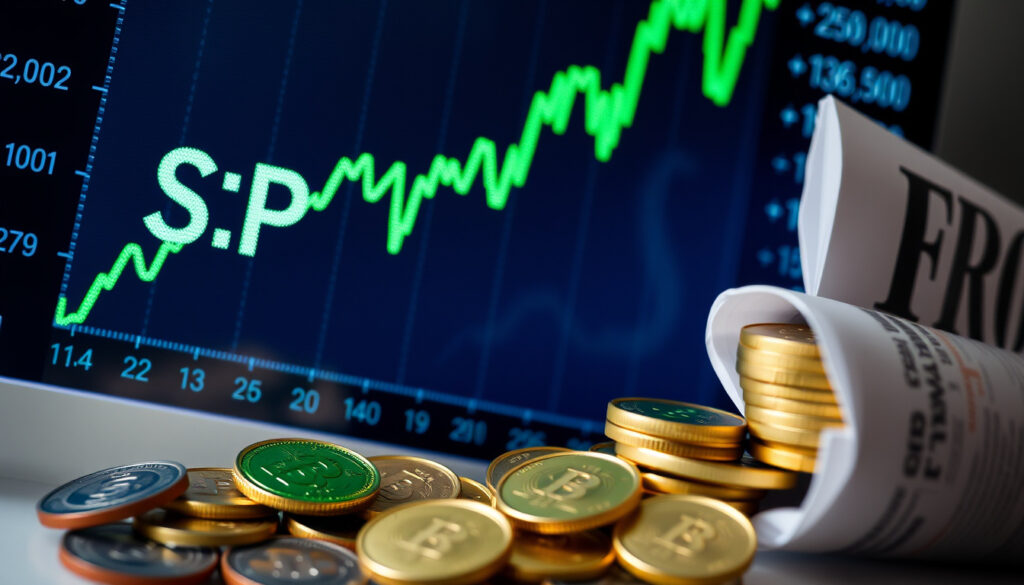
S&P 500 Share Price Today: Returns & Investing Guide
Few market benchmarks carry the weight of the S&P 500. It’s the pulse of the US economy, and for good reason—its long-term performance has turned modest savings into substantial wealth. This guide cuts through the daily noise to show you what the numbers really mean, from historical returns to Warren Buffett’s personal endorsement, and exactly how to put the index to work for your own portfolio.
Current Price: 7,575.39 ·
Day Change: +31.75 (+0.42%) ·
1-Year Return: +20.88% ·
52-Week High: 7,620.90
Quick snapshot
- The S&P 500 has never lost money over any 20-year period (Fidelity’s learning center)
- Long-term average annual return is about 10% (Fidelity’s learning center)
- Warren Buffett recommends low-cost index funds (Investopedia’s investment guide)
- Will the S&P 500 continue to double every 7 years?
- What will be the next major market correction?
- 2000-2002: Dot-com bubble burst (Slickcharts’ historical returns data)
- 2008-2009: Financial crisis (Slickcharts’ historical returns data)
- 2020: COVID-19 pandemic (Slickcharts’ historical returns data)
- 2022: Inflation concerns and rate hikes (Slickcharts’ historical returns data)
- How to invest in S&P 500 with low-cost ETFs
- Monitoring inflation and Fed policy
Five data points, one snapshot of the index’s current pulse.
| Metric | Value |
|---|---|
| Current Price | 7,575.39 |
| Day Change | +31.75 (+0.42%) |
| 1-Year Return | +20.88% |
| 52-Week High | 7,620.90 |
| Number of Companies | 500 |
The implication: even a single snapshot reveals an index that has climbed steadily, with a 1-year return that outpaces long-term averages.
What is the 10 year return of the S&P 500?
- The S&P 500 has averaged about 10% annual return over the long term (Fidelity’s learning center)
- From January 2016 through December 2025, the average 10-year return was 14.8% (Fidelity’s learning center)
- SoFi calculates a 10-year return of 11.3% (8% after inflation) from December 2014 to December 2024 (SoFi’s financial analysis)
Does the S&P 500 double every 7 years?
- The rule of 72 suggests that at a 10% annual return, an investment doubles in about 7.2 years (Investopedia’s investment guide)
- Historical data shows that the S&P 500 has doubled in roughly 7-year periods, but this is not guaranteed.
Has the S&P 500 ever lost money over a 20 year period?
- No. Fidelity confirms that the S&P 500 has never posted a negative total return over any 20-year rolling period (Fidelity’s learning center)
The pattern: these numbers show that holding through inflation and volatility still rewards patience.
What if I invested $10,000 in the S&P 500 20 years ago?
Using average annual returns from Fidelity, a $10,000 lump sum invested in early 2005 would have grown to roughly $60,000 by early 2025 (assuming dividends reinvested). This is based on the S&P 500’s historical average return of about 10% per year (Fidelity’s learning center)
What if I invested $1000 in the S&P 500 10 years ago?
- With a 10-year return of 14.8% (Fidelity), $1,000 invested in January 2016 would be worth about $3,900 by December 2025.
What if I invested $1000 in the S&P 500 20 years ago?
- Using the same 10% long-term average, $1,000 invested 20 years ago would be worth about $6,700 today.
A $10,000 investment 20 years ago would have grown sixfold—enough to fund a down payment or a child’s college education. The key takeaway: time in the market beats timing the market.
What this means: even modest sums compound dramatically over two decades.
Why is the S&P 500 falling?
- Short-term declines are driven by economic news, interest rate changes, and earnings reports. The 2022 decline of -18.11% (Slickcharts’ historical returns data) was fueled by inflation fears and Fed rate hikes.
- Market corrections (10%+ drops) occur on average every 1-2 years and are a normal part of the cycle.
Every major dip in the last 25 years—2000, 2008, 2020, 2022—was followed by a recovery within 2-4 years. Panic selling is the only reliable way to lock in a loss.
The implication: corrections are buying opportunities for disciplined investors.
What does Warren Buffett think of the S&P 500?
“The best way to own common stocks is through an index fund that charges minimal fees.”
— Warren Buffett, 2013 letter to Berkshire Hathaway shareholders (Investopedia’s investment guide)
What is Warren Buffett’s investment strategy?
- Buffett’s 90/10 framework: 90% in a low-cost S&P 500 index fund, 10% in short-term government bonds (Investopedia’s investment guide)
- He advises against stock-picking for most people.
Does Warren Buffett recommend index funds?
- Yes, he has repeatedly said that low-cost index funds outperform most active managers after fees (AEI’s commentary)
- His 10-year bet against hedge funds, won by the S&P 500 index fund, is a famous case study (CNBC’s report)
The catch: even Buffett’s strategy requires staying invested through downturns.
How to invest in S&P 500?
Three steps, one pattern: start small, stay consistent, and watch fees.
- Choose a brokerage account – Platforms like Vanguard, Fidelity, or Charles Schwab offer commission-free trading.
- Select an index fund – Two popular options:
- VOO (Vanguard S&P 500 ETF) – expense ratio 0.03%
- SPY (SPDR S&P 500 ETF) – expense ratio 0.0945%
- Set up automatic contributions – Dollar-cost averaging reduces the impact of market volatility.
What are the best S&P 500 index funds?
- VOO (Vanguard) – low cost, widely recommended.
- SPY (State Street) – most liquid, slightly higher fee.
- IVV (iShares) – similar to VOO, expense ratio 0.03%.
How to buy S&P 500 ETFs?
- Open a brokerage account, deposit funds, search for the ticker (e.g., VOO), and place a market order.
- Consider using a robo-advisor like Betterment or Wealthfront if you prefer hands-off management.
Low-cost ETFs are the cheapest way to invest, but they still carry market risk. The key is to avoid trading frequently and to reinvest dividends.
The bottom line: starting early and sticking to a plan beats trying to time the market.
Timeline: Key Events in S&P 500 History
- 2000-2002: Dot-com bubble burst – S&P 500 fell 49% from peak to trough.
- 2008-2009: Financial crisis – index dropped 57%.
- 2020: COVID-19 crash – 34% decline in 5 weeks, followed by a rapid recovery.
- 2022: Inflation and rate hikes – index fell 18.11% (Slickcharts’ historical returns data).
The pattern: every major drawdown was followed by a new high within 2-5 years.
What We Know and What Remains Unclear
Confirmed facts
- The S&P 500 has never lost money over any 20-year period (Fidelity’s learning center).
- Warren Buffett has recommended index funds (Investopedia’s investment guide).
- The rule of 72 is a reliable approximation for doubling time at a given return.
What’s unclear
- Will the S&P 500 continue to double every 7 years? Future returns may be lower if valuations are high.
- What will be the next major market correction? Timing is unpredictable.
- Some analysts suggest the next 10-year return could be as low as 3% (YouTube discussion).
The implication: certainty about the past doesn’t guarantee future returns, but the long-term trend is clear.
Expert Quotes
“The best way to own common stocks is through an index fund that charges minimal fees.”
— Warren Buffett, 2013 letter to Berkshire Hathaway shareholders (Investopedia’s investment guide)
“The S&P 500 average 10-year return from January 2016 through December 2025 is 14.8%.”
— Fidelity (a major investment firm) (Fidelity’s learning center)
The S&P 500 has delivered a 10-year return of 14.8% per Fidelity, but that’s a historical figure, not a guarantee. For the average investor, the biggest risk is not a market crash—it’s letting fear keep you out of the market entirely. The choice is clear: start investing in a low-cost S&P 500 index fund today, or risk missing out on the compounding that has made it one of the most reliable wealth-building tools in history.
finance.yahoo.com, reddit.com, aol.com, en.wikipedia.org, youtube.com
Frequently asked questions
What is the S&P 500 index?
The S&P 500 is a market-capitalization-weighted index of 500 large U.S. companies, widely considered the best gauge of the U.S. stock market.
How many companies are in the S&P 500?
500. Despite the name, the index has 500 companies, though it occasionally holds 501-505 due to mergers.
What is the S&P 500 dividend yield?
The current dividend yield is about 1.3% (as of early 2025).
What is the difference between the S&P 500 and the Dow Jones?
The Dow Jones Industrial Average tracks 30 large companies, price-weighted, while the S&P 500 tracks 500 companies, market-cap-weighted.
Is the S&P 500 a good investment for beginners?
Yes—low-cost index funds provide diversification, low fees, and a long history of positive returns.
How often does the S&P 500 rebalance?
Quarterly, and the index committee can add or remove companies at any time.
What is the S&P 500 P/E ratio?
As of early 2025, the S&P 500’s forward P/E ratio is roughly 21-22, above the historical average of 16-17.
More related posts
 How to Calculate CAGR in Excel: Formula & Examples
 Badminton All England 2025: Dates, Tickets, Schedule & Players
 Sec 1 Math Tuition Fees, Options & Tips
 Soo Kee Jewellery Employee Fraud: Case, Signs & Prevention
 300 RMB to SGD: Real Rate & Hidden Fees Explained
 Convert Video to MP3 Free in 3 Steps (Online No Software Needed)
 Li Auto HK Share Price: Buy, Hold, or Sell Now
 Gold Rate in Singapore Today: 22K & 24K Per Gram
